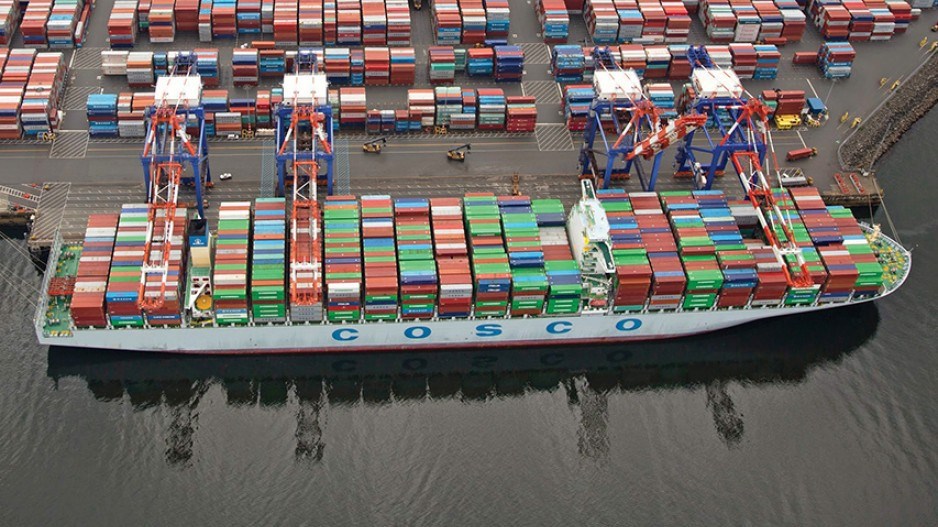
Cargo handled via Canada's West Coast ports grew faster than it did through their American cousins between 2017 and 2018.
Vancouver realized a 3% increase in the number of 20-foot-equivalent units (TEUs) moved through its facilities in 2018: 3,396,449 compared with 3,252,220 in 2017. Total tonnage was up 3.5% to 147 million metric tonnes (MMT) from 142 MMT. Between 2016 and 2017, TEUs rose 11% and tonnage increased 5%.
The biggest gain through Vancouver port facilities was in petroleum products, including aviation and jet fuel, crude petroleum, diesel and fuel oils and gas. Those rose to 8.44 MMT from 6.3, a gain of 33.3%. The previous year there was a 1% drop.
Other gains were modest. Fertilizers increased 16.1% to 11.5 MMT from 9.9 compared with a 7% drop the year before; machinery, vehicles, construction and materials rose 5.6%, to 6.3 MMT from 6 MMT, compared with a 9% increase between 2016 and 2017; coals rose 2.1% to 37.6 MMT from 36.8 compared with a 12% gain the year before; and consumer and related goods increased 1.9% to 9.17 MMT from 9 MMT on top of the previous year's 8% rise.
Animal products, dairy and produce posted a slight increase of 0.8% to 1.59 MMT from 1.58, a drop from the 7% jump in 2016-17.
On the other side of the ledger, chemicals, basic metals and minerals declined 4%, dropping to 36.8 MMT from 17.13. That's against an increase of 7% in 2016-17.
Prince Rupert's container cargo continues to grow. It jumped 12%, four times Vancouver's 3% increase, to 1,036,009 TEUs last year from 926,539 in 2017.
All other Prince Rupert terminals combined realized a 10% increase, with 26.67 MMT moved compared with 24.17 MMT in 2017.
Prince Rupert Grain Ltd., which handles barley, canola, oats, soybeans and wheat, saw a 6% cargo decline from 5.77 MMT in 2017 to 5.44 MMT in 2018. Coke and coal traffic jumped 21% to 9.12 MMT from 7.56.
Prince Rupert plans to increase annual TEU throughput capacity to 1.8 million by 2022 from 1.3 million. The port moved past the one-million-container-per-year mark December 18.
Prince Rupert's potential terminal traffic received a boost March 27 when the world's 11th-largest container carrier, ZIM Integrated Shipping Services, (ZIM) announced it had partnered with the 2M Alliance vessel-sharing agreement and added Prince Rupert to its North American trade loop.
The Northwest Seaport Alliance (Seattle-Tacoma) realized marginal TEU growth of 2.5%, increasing to 3,797,626 last year from 3,702,174 in 2017. That was also an increase compared with 3,615,752 TEUs in 2016. The port moved a total of 30.17 MMT in 2018, a 9.4% increase from 27.57 in 2017.
Break bulk increased 18.1% to 248,933 from 210,725 metric tonnes, autos rose 1.4% to 228,295 tonnes from 225,109 and container cargo was up 10.6% to 28.87 MMT from 26.1 MMT. Log movement plummeted 58% to 116,790 tonnes from 278,078 and petroleum fell 7% to 665,670 tonnes from 715,546.
The port increased its loading capacity early in 2018 with the addition of four post-Panamax cranes. Another four arrived in March, increasing the port's handling capacity to two 18,000-TEU container ships at once.
And the port is set to boom as its board of directors on April 2 approved a US$500 million expansion of Terminal 5. The port said the project would give it the capacity to handle seven million TEUs annually by 2050.
Meanwhile, Oakland is set to increase its freight handling with the addition of three 300-foot-tall gantry cranes at the Oakland International Container Terminal in 2020.
They will be capable of handling megaships up to 1,300 feet long and carrying nearly 23,000 cargo containers arranged in vertical stacks of 12 on the largest vessels.
Oakland's TEU movement continues to rise, to 2,546,351 in 2018 from 2,420,937 in 2017, an increase of 5% compared with a rise of 2.1% in 2016.
While moving the West Coast's largest amount of cargo, the Port of Los Angeles saw a TEU traffic increase of only 1.2%. It moved 9,458,748 TEUs in 2018, 9,343,192 in 2017 and 8,856,782 in 2016.
That, in part, reflects total tonnage of 194.5 million revenue tonnes, a drop from 198.1 million but still an increase over previous years.
Los Angeles moved 156,091 vehicles in 2018, a drop of 34% compared with 236,956 in 2017. The port handled 905,886 tonnes of scrap metal compared with 719,884 the year before, a 25.8% increase; 2.1 MMT of steel, a 0.01% increase from the 2.08 MMT of 2017; 90,624,559 barrels of liquid bulk, down 8.37% from 98,908,750 barrels; and 80,892 tonnes of fruit, up 7.8% from 75,038 tonnes.
The adjacent Port of Long Beach saw TEU growth of 7.2% with 8,091,023 TEUs moving in 2018 over 7,544,507 the previous year. That was up from 6,775,171 TEUs in 2016.


